

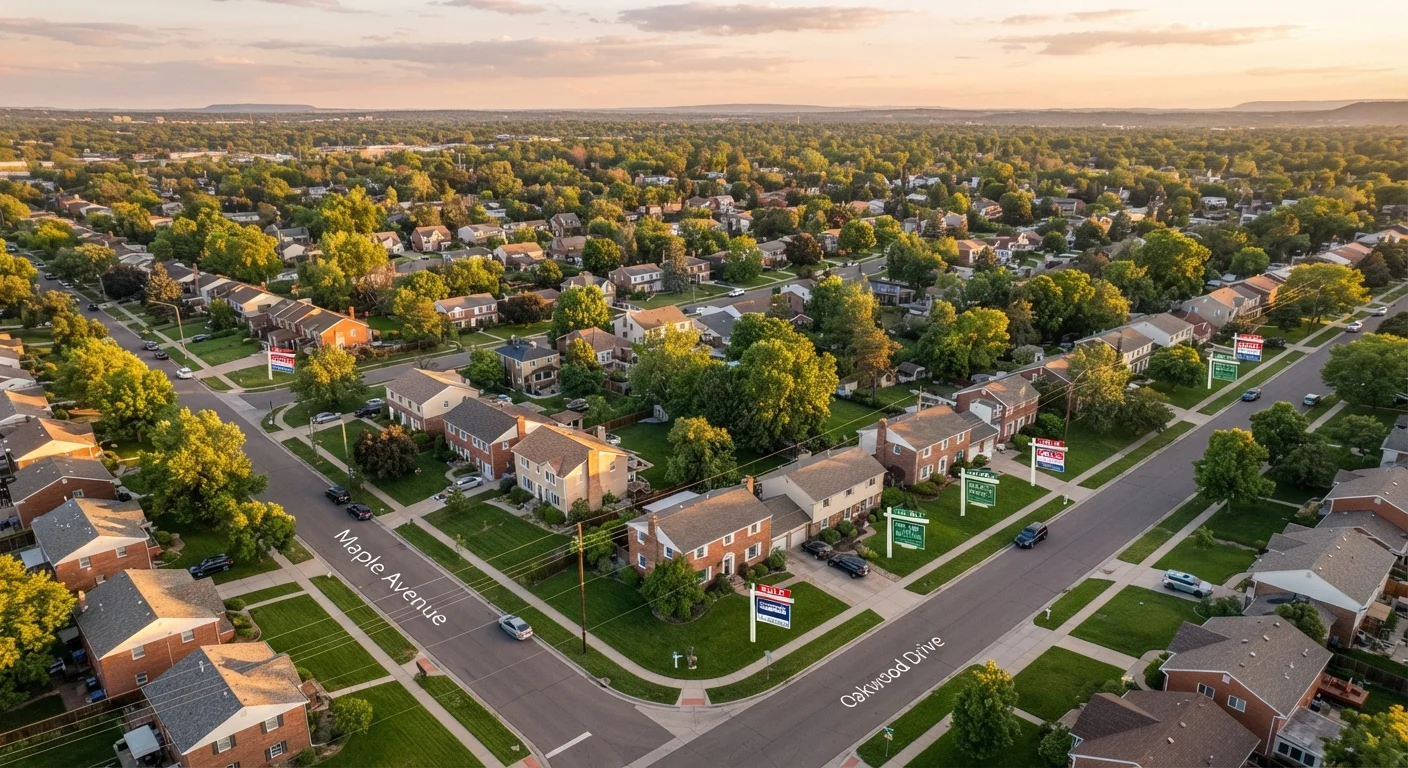
Why Housing Markets Move in Cycles
Real estate doesn't move in a straight line. Prices rise, then level off, then fall, then recover - and the pattern repeats, driven by the same fundamental forces each time. If you've ever felt confused by headlines swinging from "housing boom" to "market correction" within a few years, understanding cycles is the missing frame.
The housing market is shaped by supply and demand, just like any market. When jobs are plentiful and borrowing is affordable, more people compete for homes. That competition drives prices up. Eventually, affordability tightens, demand cools, and the market shifts direction. These aren't random events - they follow a recognizable sequence.
Cycles play out differently at the national level versus locally. A city adding thousands of jobs may be in full expansion while a nearby region with a struggling economy is already contracting. That's why local data - not just national headlines - matters most to everyday buyers and renters.
18 years
Estimated length of some full U.S. housing cycles
Research from the Lincoln Institute of Land Policy and other housing economists suggests full peak-to-peak cycles have historically ranged from about 7 to 18 years, though variation is significant.
~4 months
Supply level often signaling a balanced market
The National Association of Realtors has historically described roughly 4-6 months of housing supply as consistent with a balanced market between buyers and sellers.
The Four Phases, Broken Down
1. Expansion
Expansion is when conditions are favorable: employment is growing, mortgage rates are manageable, and consumer confidence is up. More people are buying homes, inventory is shrinking, and prices start to climb. Construction activity picks up as builders respond to demand. For buyers, this phase often means competition - multiple offers, homes selling quickly, and little room to negotiate.
2. Peak
At peak, the market has reached its highest point of activity and price growth. Demand is still strong, but affordability has stretched. Price growth may slow, and some buyers begin to wait on the sidelines. The peak is often clearest in hindsight - it can be hard to identify in real time. See early warning signs of a shifting market for what to watch.
3. Contraction
Contraction (sometimes called a correction or downturn) sets in when demand falls faster than supply. Inventory rises, homes sit on the market longer, and sellers begin cutting prices. This phase can be triggered by rising interest rates, job losses, or simply prices climbing beyond what buyers can afford. Contraction doesn't always mean a crash - most contractions are gradual adjustments.
4. Recovery
Recovery begins when the market stabilizes and buyers return. Prices may still be flat or declining slightly, but inventory starts to be absorbed again. Confidence slowly rebuilds. Recovery can be slow and uneven - some neighborhoods bounce back faster than others depending on local job markets and new construction activity.
What Drives the Cycle
Several forces push housing markets through their phases. Interest rates, inventory levels, and employment are the biggest levers. When rates rise sharply, monthly mortgage payments increase, pricing some buyers out of the market and cooling demand relatively quickly. When rates fall, the reverse happens.
Housing supply - how many homes are available for sale - is equally important. A shortage of listings intensifies competition and keeps prices elevated even when other conditions weaken. Conversely, a surge of new construction can ease price pressure and extend or deepen a contraction.
Local economic conditions matter enormously. A single large employer relocating to or from a metro area can shift its housing market independent of national trends. That's why two cities in the same state can be in entirely different phases at the same time.
Track These Three Local Indicators
To get a sense of your local market's phase, monitor median days on market, active listing counts, and the sale-to-list price ratio over several months. Most local MLS associations and sites like Zillow Research or Realtor.com publish this data publicly. Trends matter more than any single month's snapshot.
How to Use This Knowledge as a Consumer
Understanding cycles won't predict the future - no one can do that reliably - but it does help you put current conditions in perspective. If prices in your area have risen sharply for several years and inventory is thinning, you're likely in expansion or approaching peak. If you're seeing more listings sit unsold and price reductions appearing, contraction may be underway.
For buyers, knowing the cycle phase can shape your approach to negotiation and timing, though your personal financial readiness matters more than market timing. For renters, cycles affect rental prices too - especially when the for-sale market tightens and more people stay in rental housing longer. Learn more in our renting basics hub.
If you're new to tracking real estate, this first-timer's orientation is a useful starting point before diving deeper into cycle analysis. And if you want to decode the terms you'll encounter along the way, our jargon decoder explains common phrases like days on market and absorption rate in plain English.
This article is for general informational and educational purposes only and does not constitute financial, investment, or real estate advice. Consult a licensed real estate professional or financial adviser for guidance specific to your situation.
Frequently Asked Questions
There is no fixed length. Historical data suggests full cycles have ranged from roughly 7 to 18 years in the U.S., though individual phases vary widely. Local economic conditions, policy changes, and major events can all accelerate or extend any given phase.
Look at trends in home prices, days on market, and available inventory over the past 6-12 months. Rising prices with low inventory typically signal expansion or peak conditions, while rising inventory and price cuts suggest contraction. Resources like local MLS reports and the National Association of Realtors publish regional data.
Yes. Rental demand and rental prices are closely tied to the for-sale market. During contractions, some would-be buyers remain renters longer, which can push rents higher. During expansions, new construction may add rental supply and ease pressure on rents.
Markets rarely skip phases entirely, but they can move through them quickly or slowly. A sudden economic shock - like a major employer leaving a region - can compress what might have been a gradual contraction into a sharper, faster decline.
That depends on your personal financial situation, local market conditions, and how long you plan to stay in the home. This article is general education, not financial advice - consult a licensed financial adviser or real estate professional to evaluate your specific circumstances.
The content on this site is for informational purposes only and is not a substitute for professional advice. Always consult a qualified professional for guidance specific to your situation.